Classifying Stocks by Return
Fingerprints
Artificial Intelligence
Link to paper
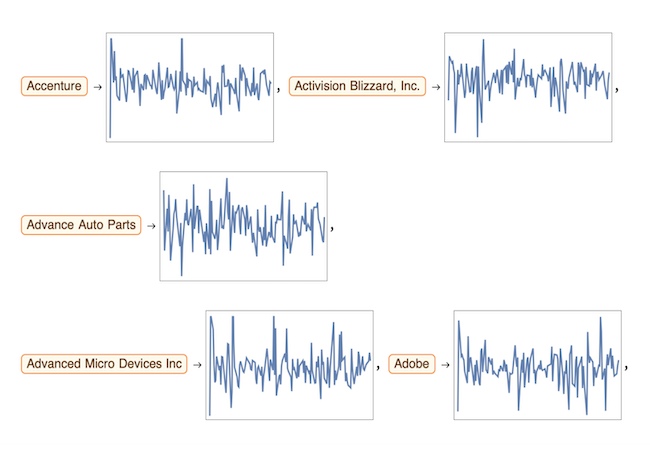
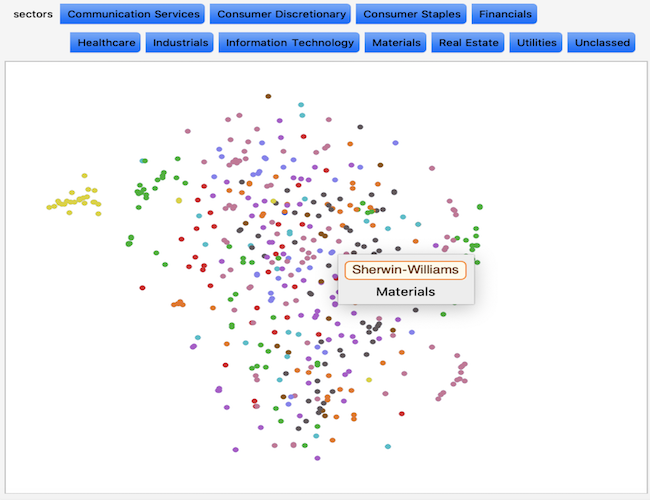
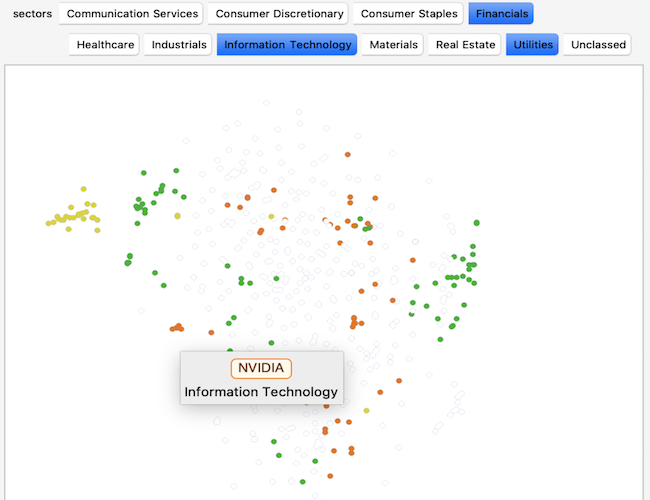
In this project, I used machine learning to analyze the "return fingerprint" of stocks in the S&P 500. Would the computer tell me that Facebook and Twitter are similar, if I gave it no context? To isolate the return fingerprint from the rest of the variable factors, I trained the computer on Date Plots. I aimed to correctly group stocks by fingerprint (within the time frame of a year). Dots of the same color cluster together into smaller subgroups, confirming that industry has a big influence on the similarity between stocks. While not all stocks in a sector clustered in one big group, most tended to cluster near at least two others of the same sector.