RESEARCH PAPERS
My published papers in artificial intelligence, machine learning, and engineering.
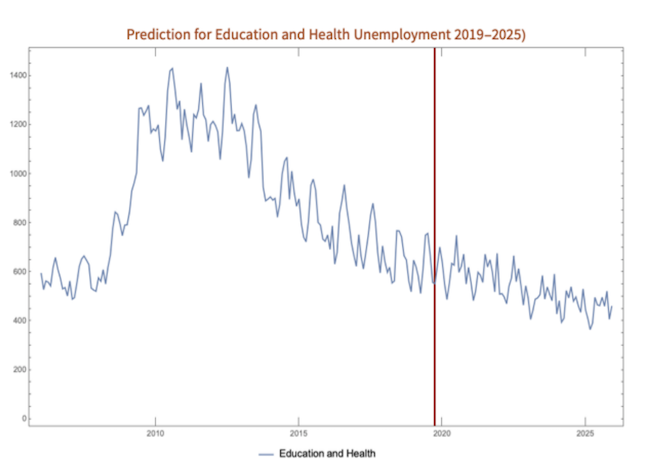
Predicting Unemployment in the USA
Artificial Intelligence
Have you ever thought about why the unemployment rates in certain regions always remain low while other regions show consistent high unemployment? Do you want to know what contributes to unemployment, and if analyzing unemployment rates to reveal hidden patterns or correlations in society? In 2019, my team of AI researchers crunched data from the Bureau of Labor Statistics to analyze unemployment rates of various demographics, and we used this data to create and test an unemployment rate predictor. We created algorithms to predict unemployment by region, race, and industry.
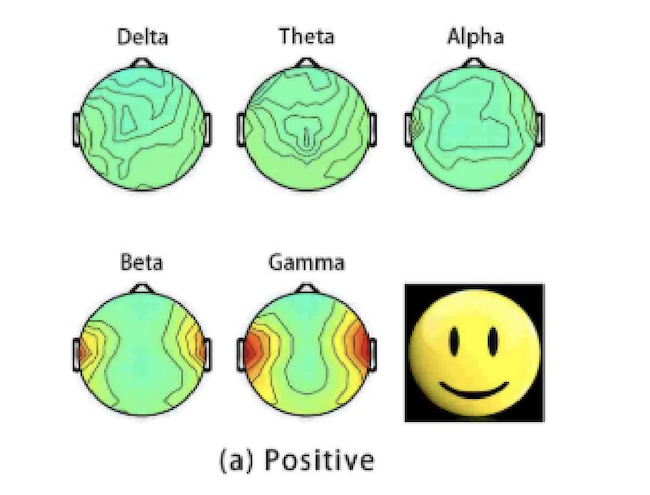
Decoding Emotions from Brain Signals
Artificial Intelligence
Despite playing such a large role in human interactions and decision making, emotions are not well understood. When we experience emotions, the neurons in our brains propogate electrical signals that can be detected by electroelcephalography (EEG) caps placed on the scalp. Being able to classify and quantify an individual’s emotions has useful applications in many fields, such as medical treatment and commercial product testing. I trained a Long Short-Term Memory (LSTM) recurrent neural network to find correlations between EEG data and self reported emotional scores. The trained LSTM neural network achieved a reasonable accuracy in predicting valence (happiness) scores given EEG signals. This project was conducted by my team during the 2020 Governors School of Engineering and Technology.
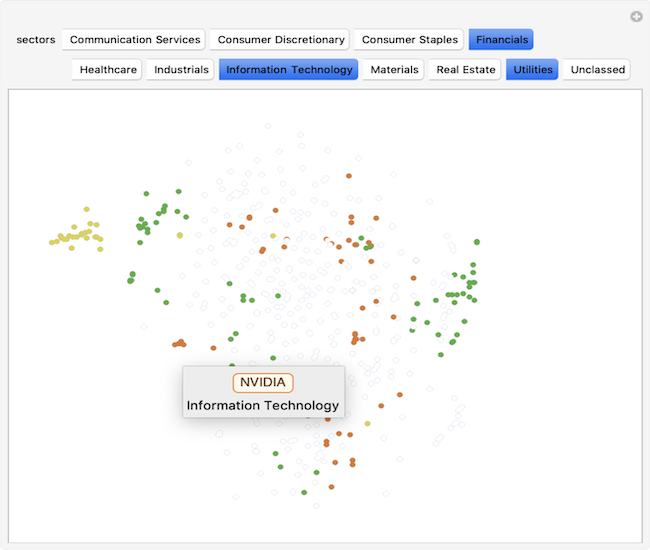
Classifying Stocks by Return Fingerprints
Artificial Intelligence
In the stock market, the returns (% change in price of the stock between days) of any particular stock create a fingerprint unique to that stock. For example, the returns of Tesla and Johnson & Johnson are very different, since they are shaped by variable factors such as industry, size, and volatility. In this project, I used machine learning to analyze the "return fingerprint" of stocks in the S&P 500. Would the computer tell me that Facebook and Twitter are similar, if I gave it no context? To isolate the return fingerprint from the rest of the variable factors, I trained the computer on Date Plots. I aimed to correctly group stocks by fingerprint (within the time frame of a year). Dots of the same color cluster together into smaller subgroups, confirming that industry has a big influence on the similarity between stocks. While not all stocks in a sector clustered in one big group, most tended to cluster near at least two others of the same sector.